Logging Amazon FSx for NetApp ONTAP
Recently, I spent a lot of time using the exciting new member of the FSx family. One detail made working with it a bit unpleasant, though - the lack of log files.
This post details how to create a custom integration into CloudWatch Logs and make ONTAP audit logs visible.
Update 2022-04-28: Fixed configuration in the last step, actually applying the filter and adding a missing exclamation mark to the filter expression
Audit logs fulfill the same purpose on a storage cluster as CloudTail does on AWS: they record user activity with a clear focus on configuration changes.
FSx for NetApp ONTAP Architecture
While FSx makes consuming managed storage easy, it hides some of the underlying complexities. In this case, we get a Management endpoint IP and can create Storage Virtual Machines (SVMs) with their own endpoints.
SVMs provide multitenancy on your filesystems. In principle, you could create multiple SVMs and let every department manage its own storage. This component provides a clear management boundary between core infrastructure and tenants/departments.
But in addition, each cluster also has Admin SVMs which handle the underlying infrastructure. They are reachable via SSH or REST API to allow advanced configuration, debugging, and automation (Terraform, Ansible, Chef, etc.).
These Admin SVMs do provide a possibility to forward logs to a Syslog server, but as the nodes miss a default route, they can only reach their local subnet.
AWS Setup
We can provide local-subnet endpoints with AWS standard technology, though. Configuration of a Network Load Balancer in the subnets of FSx for NetApp ONTAP allows forwarding Syslog messages to some Syslog-Cloudwatch bridge instance.
The following steps will set this infrastructure up:
- Create an internal Application Load Balancer, placed in the two subnets of ONTAP (assuming a multi-AZ deployment)
- Add a listener to 514/TCP (Syslog)
- Create an EC2 Instance in any subnet
- Allow the same 514/TCP incoming in its security group
- Configure this instance as a listener to 514/TCP on your ALB
Cluster Configuration
Now, you can SSH into your FSx Management Endpoint and configure log forwarding:
cluster log-forwarding create -destination <NLB-IP1> -port 514 -protocol tcp-unencrypted
cluster log-forwarding create -destination <NLB-IP2> -port 514 -protocol tcp-unencrypted
We need both statements as we do not have cross-subnet routing capabilities and have to include the possibility of a failover of the cluster.
EC2 Configuration
Amazon Linux 2 already has RSyslog preinstalled, which can listen for TCP-based Syslog messages and write them to the local filesystem. Configuring this is straightforward.
cat >/etc/rsyslog.d/network.conf <<CONFIG
# Provides UDP syslog reception
$ModLoad imudp
$UDPServerRun 514

# Provides TCP syslog reception
$ModLoad imtcp
$InputTCPServerRun 514

$template RemoteLogs,"/var/log/%HOSTNAME%/%PROGRAMNAME%.log"
*.* ?RemoteLogs
& ~
CONFIG

systemctl restart rsyslog
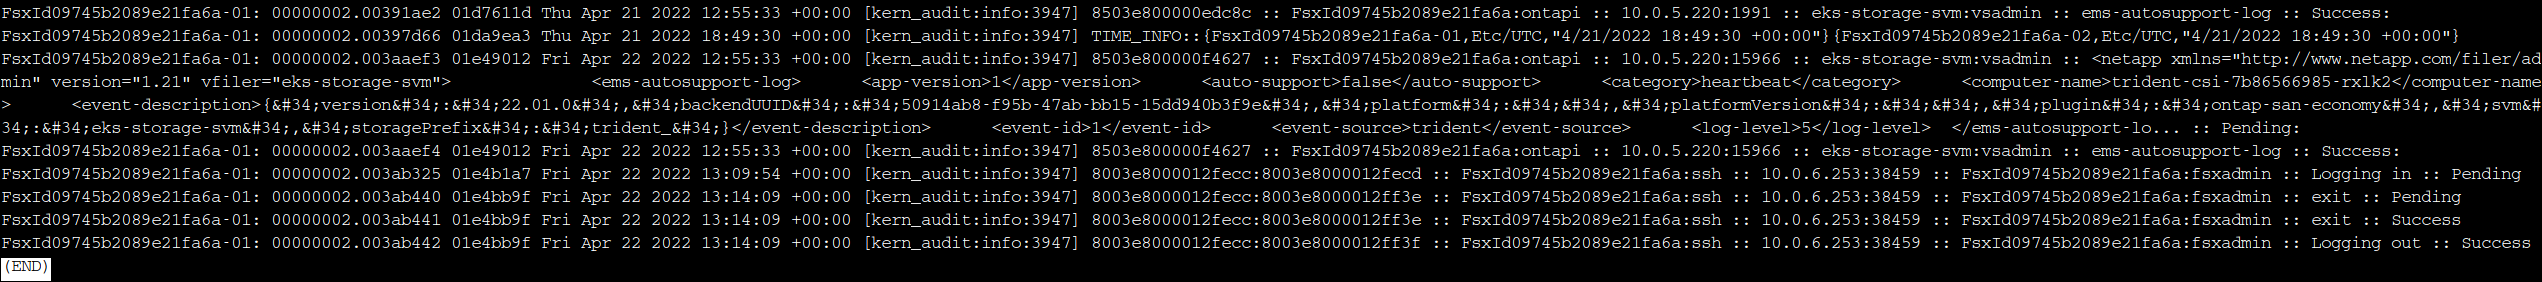
You should notice logs appearing in your log directory as soon as you log into the FSx Management Endpoint again via SSH.
Redirect to CloudWatch Logs
We could now pick up these logs with the CloudWatch unified agent, but we can make something even more potent with a third-party tool: Vector.
Vector is a free, modern observability tool that can ingest logs and metrics in almost every format. Then, it can filter and transform messages and forward them into many different backends.
As you might have guessed, it can ingest Syslog via network and write this to CloudWatch Logs. So let’s set this up:
# Remove our previous test
rm /etc/rsyslog.d/network.conf
systemctl restart rsyslog

# Install Vector
VECTOR_VERSION="0.21.0"
yum install https://github.com/vectordotdev/vector/releases/download/v${VECTOR_VERSION}/vector-${VECTOR_VERSION}-1.x86_64.rpm

# Test by writing Syslog messages to a local file
cat > /etc/vector/vector.toml <<TOML
[sources.syslog_tcp]
type = "syslog"
address = "0.0.0.0:514"
host_key = "host"
max_length = 102_400
mode = "tcp"
path = "/var/run/vector.sock"
receive_buffer_bytes = 65_536

[sinks.file]
type = "file"
inputs = [ "syslog_tcp" ]
compression = "none"
path = "/tmp/vector-{{ hostname }}.log"

  [sinks.file.encoding]
  codec = "text"
TOML

vector
Now, any audit logs coming from our FSx cluster will be written into a local file. And if you direct multiple clusters to this bridge instance, they will even arrive in different files.
We have to do two more things to make this practical: Allow our instance to write to CloudWatch Logs and modify vector.toml to output data correctly.
We will use a generic CloudWatch Logs IAM policy for demonstration purposes:
{
  "Version": "2012-10-17",
  "Statement": [
    {
      "Sid": "LimitToLogStream",
      "Effect": "Allow",
      "Action": [
        "logs:CreateLogStream",
        "logs:CreateLogGroup",
        "logs:DescribeLogStreams",
        "logs:DescribeLogGroups",
        "logs:PutLogEvents"
      ],
      "Resource": "*"
    }
  ]
}
Attach an IAM role with this policy to your Syslog instance. Now, we need to update the configuration.
cat > /etc/vector/vector.toml <<TOML
[sources.syslog_tcp]
type = "syslog"
address = "0.0.0.0:514"
host_key = "host"
max_length = 102_400
mode = "tcp"
path = "/var/run/vector.sock"
receive_buffer_bytes = 65_536

[transforms.filter_fsx]
type = "filter"
inputs = [ "syslog_tcp" ]
condition = 'starts_with!(.hostname, "FsxId")'

[sinks.cloudwatch]
type = "aws_cloudwatch_logs"
inputs = [ "filter_fsx" ]
create_missing_group = true
create_missing_stream = true
group_name = "fsx-for-netapp-ontap"
compression = "none"
region = "eu-central-1"
stream_name = "{{ host }}"

  [sinks.cloudwatch.encoding]
  codec = "json"
TOML

systemctl start vector
systemctl enable vector
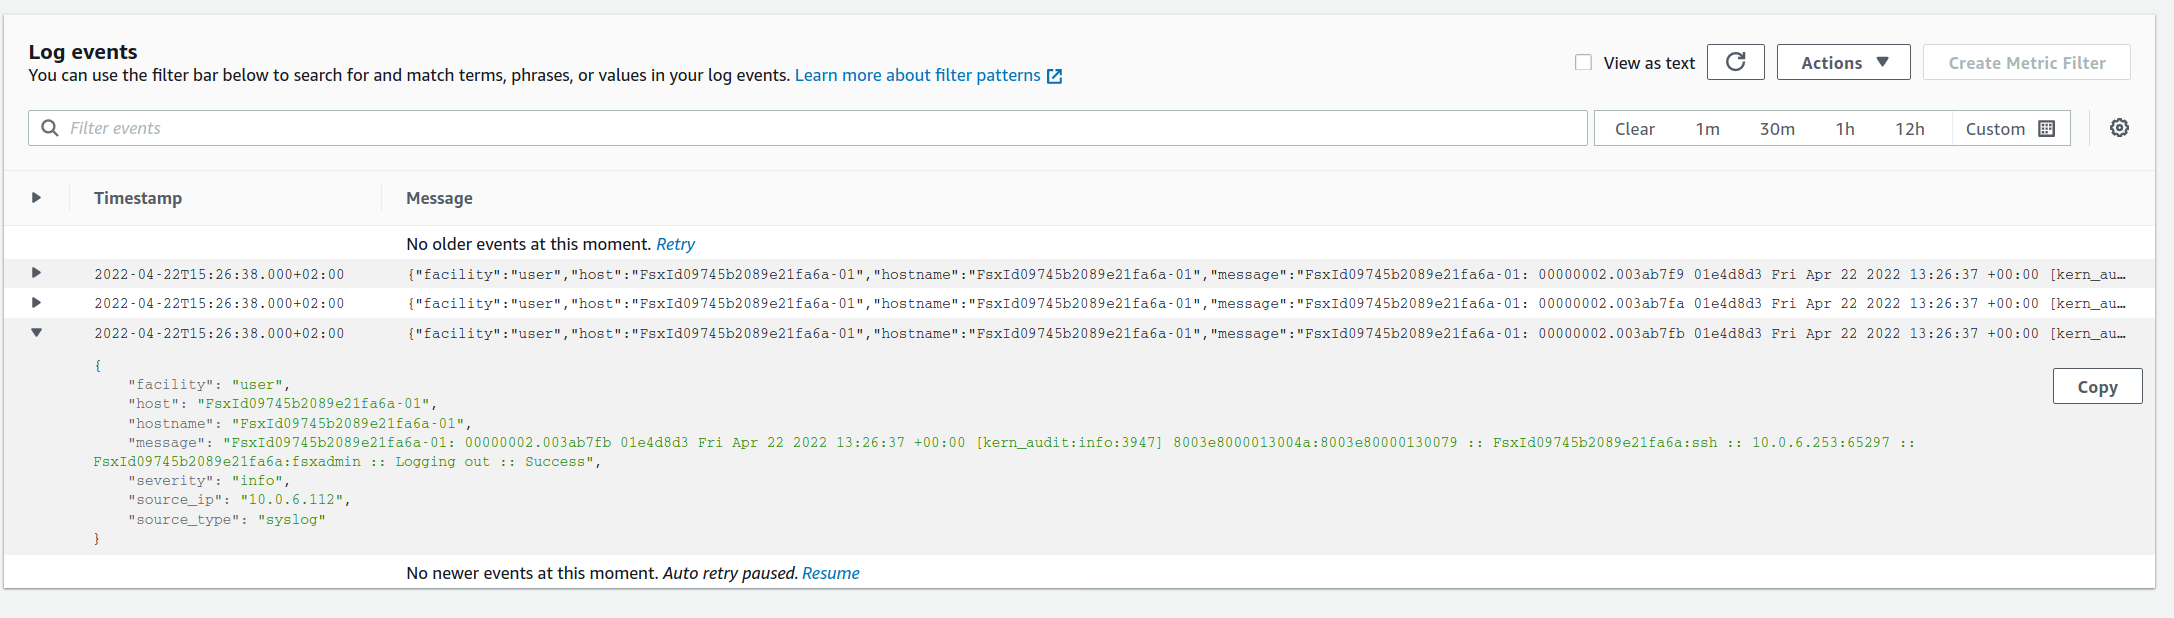
Any log messages received via 514/TCP will be filtered for the correct hostname (starting with FsxId) and then written into our log group. As we enabled Vector for every system boot, this will now automatically forward logs - even in case of failover/failback events.
Summary
With this post we have a solution to have basic audit logging of our FSx for NetApp ONTAP cluster until AWS integrated native logging functionality. We had to revisit ONTAP architecture and admin SVMs, find a routing problem in the standard AWS service setup and a way around it. In addition, we learned about Vector which brings a whole new array of logging capabilities.
I hope you found this post useful and it makes your debugging easier.